Ellis Berger · 14 September 2026
Lanewood's Main Street Rush Hour Data Sparks Fresh Looks at Commuter Flow Patterns
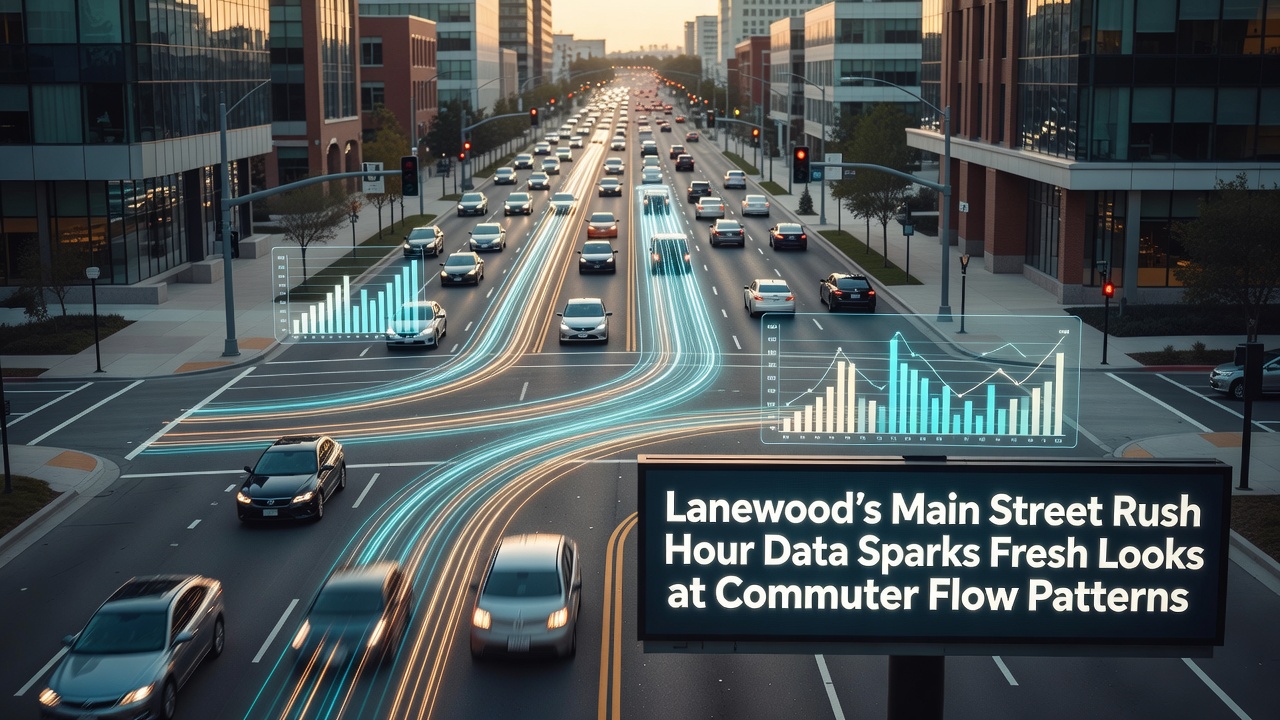
Transportation officials in Lanewood released detailed rush hour statistics from Main Street in September 2026, and those numbers have led planners to review how commuters move through the corridor each weekday. The data, gathered from embedded road sensors and aggregated mobile device signals, covers peak periods between 6:30 a.m. and 9:30 a.m. plus the evening window from 4:00 p.m. to 7:00 p.m., and it shows measurable changes in both volume and timing compared with records from 2023.
Data Sources and Collection Methods
City engineers installed additional inductive loop detectors along the six-block stretch of Main Street in late 2024, while a private traffic analytics firm supplied anonymized location pings from navigation apps used by drivers and transit riders. The combined dataset logs more than 42,000 vehicle passages on an average weekday, with breakdowns by hour, direction, and vehicle class. According to the Federal Highway Administration's commuter pattern reports, similar sensor networks in mid-sized communities have produced accuracy rates above 94 percent when cross-checked against manual counts.
Officials also incorporated ridership figures from the regional bus authority and bicycle counter readings at two intersections. These layers allow analysts to separate single-occupancy vehicle traffic from bus, bicycle, and pedestrian movements, giving a clearer picture of how different modes interact during peak times.
Observed Shifts in Rush Hour Timing
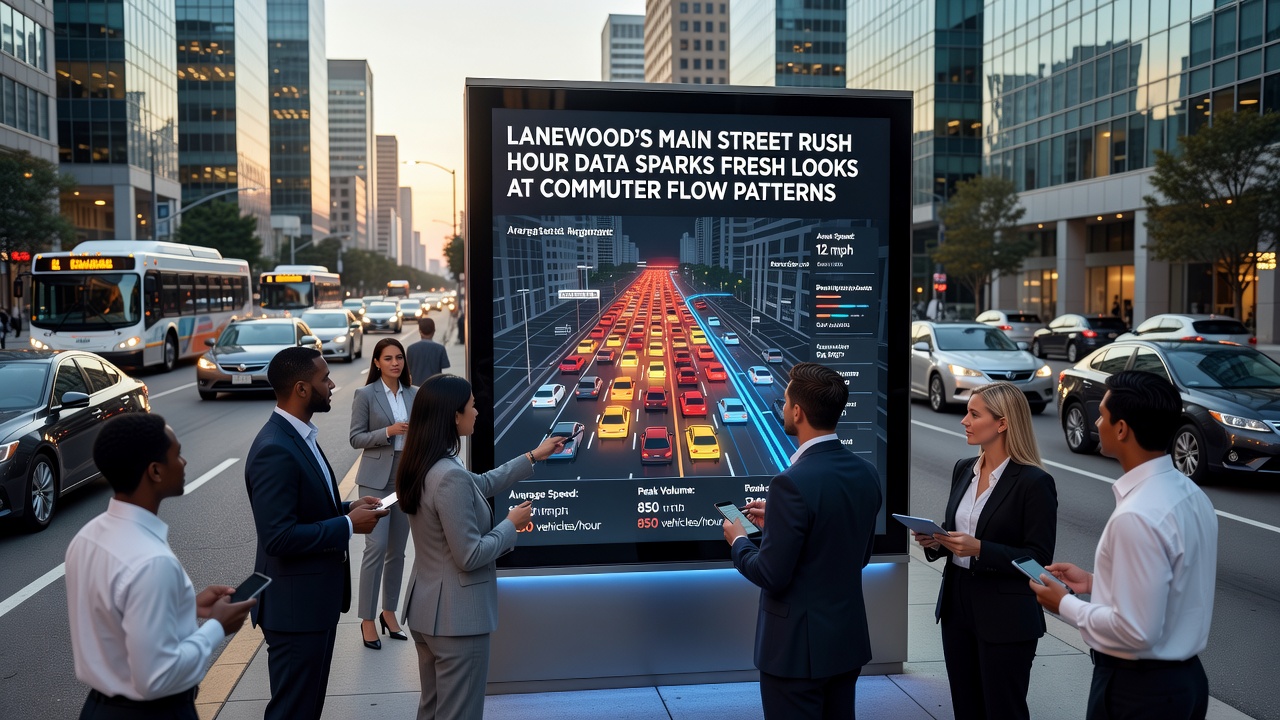
Morning peak volume on Main Street now begins 12 minutes earlier than it did in 2023, with the heaviest flow occurring between 7:05 a.m. and 8:10 a.m. Evening peaks have flattened slightly, spreading across a longer window that extends past 6:30 p.m. on three weekdays. Data shows westbound traffic leaving the downtown core has increased by 8 percent since 2024, while eastbound entries have grown by only 3 percent over the same period.
Researchers at the University of British Columbia's transportation lab have documented comparable timing shifts in other mid-sized North American cities, noting that hybrid work schedules often push some travelers into earlier or later windows rather than eliminating trips entirely. Lanewood's figures align with those broader observations without requiring any local interpretation beyond the raw counts.
Intersection Performance and Bottleneck Locations
Three signalized intersections on Main Street recorded average delays of 48 seconds per vehicle during the morning peak in September 2026, down from 61 seconds recorded in the previous year's study. The reduction appears tied to adjusted signal timing implemented in March 2026, although city engineers have stated that further optimization may be needed at the Elm Street crossing where left-turn volumes have risen steadily since new office construction opened nearby.
Freight movement data collected through the same sensors indicates delivery trucks now account for 11 percent of morning traffic on the corridor, concentrated between 6:45 a.m. and 7:30 a.m. This segment interacts with commuter flows at the two central intersections, and planners have flagged it for potential loading zone adjustments in upcoming capital plans.
Connections to Regional Planning Efforts
teh Main Street dataset feeds directly into the metropolitan planning organization's 2027 update of its long-range transportation model. That model incorporates similar traffic counts from neighboring jurisdictions, allowing analysts to trace how local patterns connect to highway ramps three miles north of the city center. A 2025 study published by the European Conference of Transport Research Institutes demonstrated that corridor-level data improves the accuracy of regional forecasts when merged with highway sensor information, and Lanewood officials have cited that methodology in their current review process.
Public works staff have scheduled three community briefings in October 2026 to present the numbers to residents and business owners along the corridor. The meetings will focus on explaining how the recorded volumes translate into proposed signal changes and sidewalk improvements rather than on any policy recommendations.
Conclusion
The September 2026 release of Main Street rush hour figures provides a detailed snapshot of commuter movement through one of Lanewood's primary corridors. Combined sensor and mobile data reveal modest shifts in timing and volume that planners will now incorporate into ongoing signal optimization work and regional modeling efforts. Additional counts scheduled for early 2027 will allow direct comparison against the current baseline.