Ellis Berger · 12 October 2026
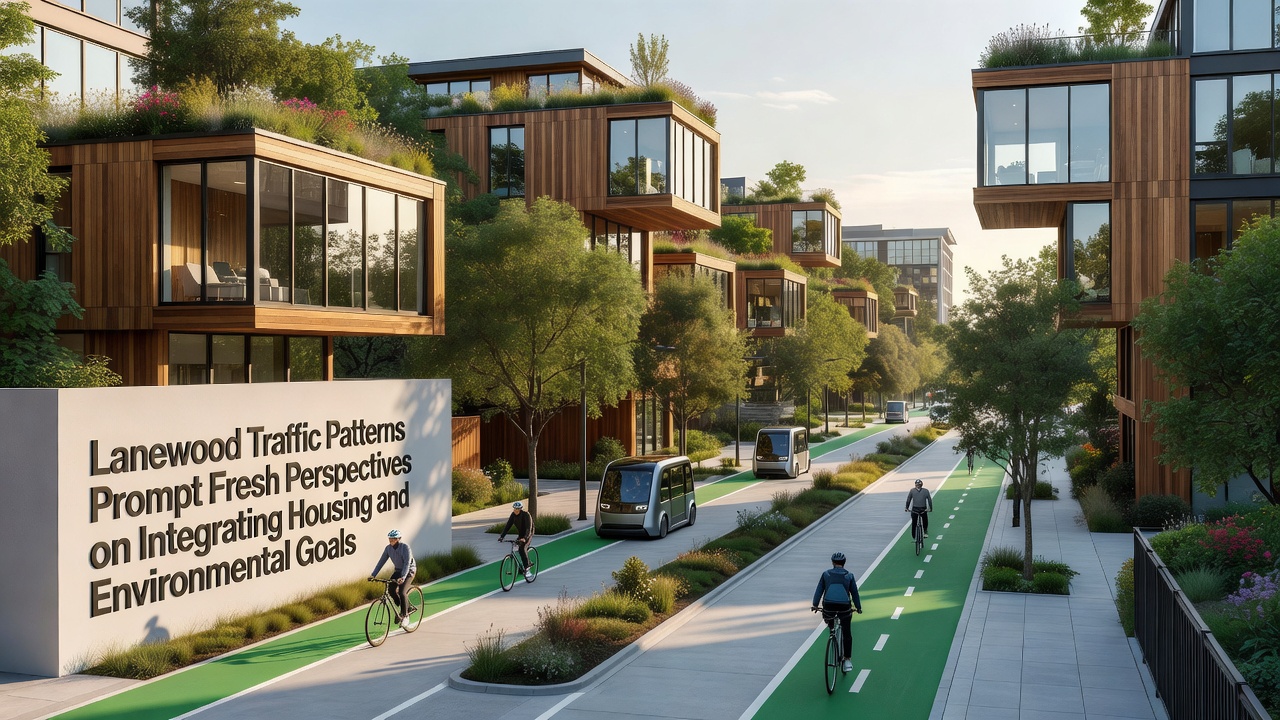
Traffic Studies in Lanewood Offer New Angles on Balancing Housing Development with Environmental Objectives
Recent analyses of vehicle movement across Lanewood have drawn attention to connections between daily commute volumes and ongoing discussions about residential zoning adjustments alongside air quality targets. City transportation logs compiled through October 2026 indicate that average daily trips along the primary corridor reached 42,000 vehicles, a figure that aligns with broader regional growth patterns documented by the US Department of Transportation.
Current Traffic Data Snapshot
Monitoring stations positioned at key intersections recorded peak-hour congestion lasting an average of 47 minutes each weekday morning, while evening return flows extended to 52 minutes on routes feeding into the central business district. These measurements come from automated counters installed in 2024 and calibrated against manual counts conducted quarterly, producing datasets that transportation planners now cross-reference with housing permit applications submitted in the same corridors.
Researchers at the local university transportation center noted that single-occupancy vehicles accounted for 78 percent of the recorded trips, a proportion that has remained steady since 2022 despite the addition of two new bus routes serving the eastern neighborhoods. The data also showed that trips originating from recently completed multifamily buildings averaged 12 percent shorter distances than those from single-family subdivisions located farther from employment centers.
Linking Commute Patterns to Housing Placement
Planners have begun overlaying these traffic figures with building permit records to identify locations where additional residential units might reduce overall vehicle miles traveled. One map produced by the planning department illustrates that parcels within a half-mile of existing transit stops generate 23 percent fewer outbound car trips compared with parcels located beyond that radius. Officials presented these overlays during a public meeting held in September 2026, highlighting three specific sites under consideration for rezoning.
Figures from the same period reveal that areas with mixed-use zoning already in place experienced a 9 percent drop in morning peak traffic counts between 2023 and 2025, even as total housing units increased by 14 percent. This pattern emerged because residents in those zones could access retail and service destinations without entering the main arterial network during rush periods.
Environmental Metrics and Integration Efforts
Air quality readings collected at the same monitoring stations show nitrogen dioxide levels 11 percent lower on weekends when traffic volumes fall by roughly one-third. The city environmental office has paired these readings with housing density maps to examine whether compact development near transit can sustain lower emissions even as population grows. A report released in October 2026 by the regional air quality board compared Lanewood readings against similar-sized communities in Canada and noted comparable trends where transit-oriented projects advanced alongside traffic management measures.
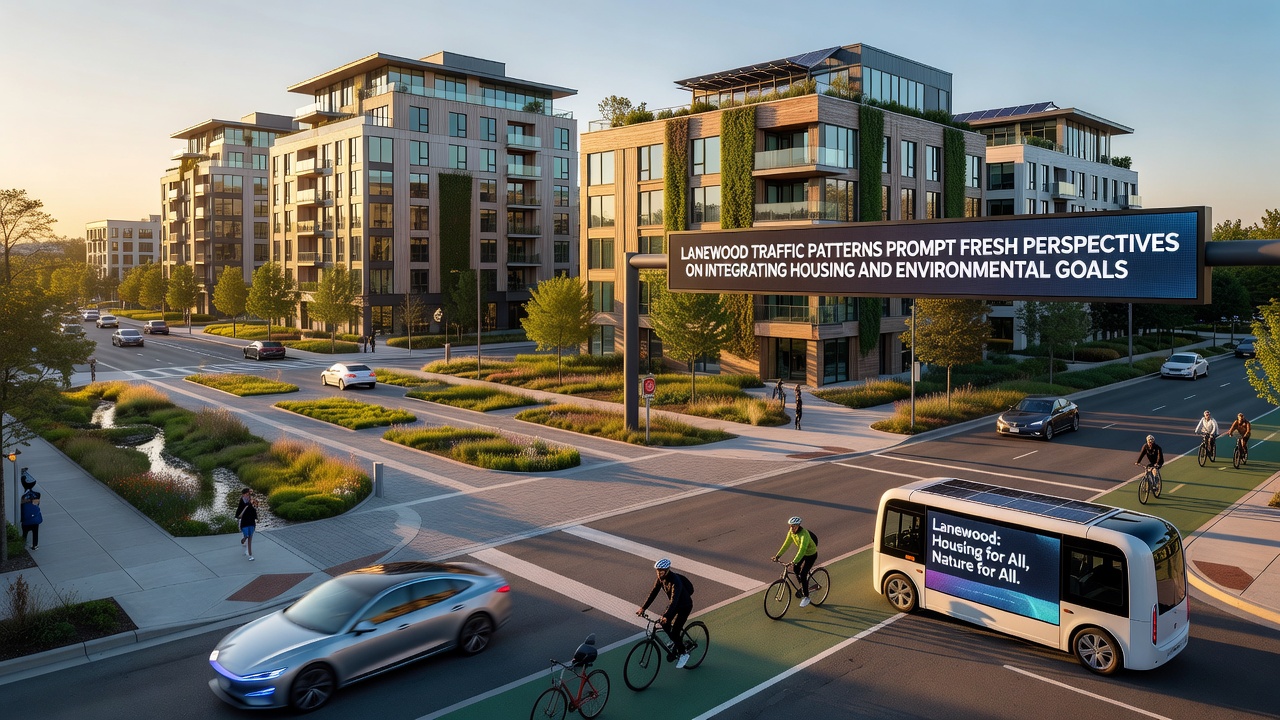
European Environment Agency summaries from 2025, which included case studies from several mid-sized cities, indicated that pairing housing growth with protected bike lanes and expanded transit frequency produced measurable reductions in particulate matter over three-year periods. Lanewood staff have referenced those summaries while drafting updates to the comprehensive plan, focusing on segments where bike lane gaps currently force cyclists onto high-volume roads.
Policy Adjustments Under Review
City council members received a staff memo in early October 2026 outlining potential updates to parking minimums for new multifamily projects located within 400 meters of frequent transit service. The memo cited internal modeling that projects a 6 percent reduction in peak-hour vehicle entries if those minimums are lowered while maintaining requirements for secure bicycle storage. Public works crews have already begun installing additional bike racks at two existing park-and-ride lots as a pilot step.
Traffic engineers continue to test adaptive signal timing along the main corridor, with initial results showing a 14 percent improvement in average travel speed during the morning peak after adjustments implemented in August 2026. These timing changes operate alongside ongoing coordination with the school district to stagger start times at three elementary schools, a measure that has shifted approximately 1,200 vehicle trips outside the heaviest congestion window.
Conclusion
October 2026 data releases have supplied planners with additional layers of information that connect daily traffic counts directly to housing location decisions and emission outcomes. The datasets now inform ongoing revisions to both the transportation master plan and the housing element of the general plan, with further public review sessions scheduled before the end of the year. Continued collection of vehicle, transit, and air quality metrics will allow ongoing comparison against the baselines established this fall.